Kpp-saprc99 comments
these pages are intended for internal use. do not rely on information reported here. in case you are interested in the info reported, do not hesitate to contact us
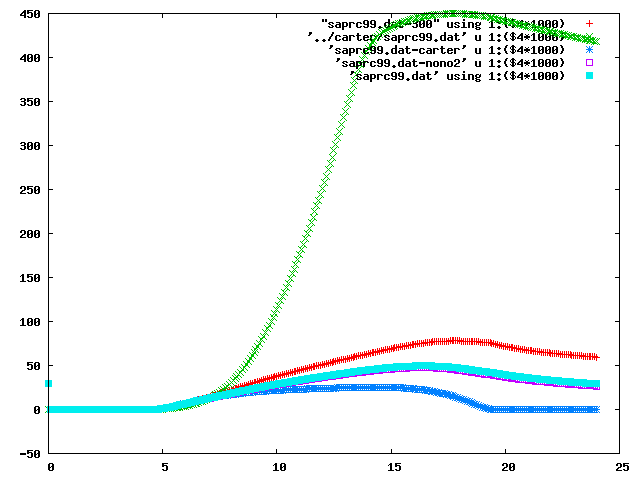
- test Baldasano gives O3 and NO concentrations comparable with Baldasano paper, but different NO2 trend (red curve)
- test Carter (green curve) is in agreement with Carter results: gives much higher O3 than test Baldasano (probably since initial VOC are higher)
- reducing test Carter to same species as in test Baldasano (Carter values)(blue curve) lead to a dramatic decrease of O3
- restoring NO and NO2 concentrations (with respect to blue curve) as in test Baldasano (magenta curve), an increase in O3 is obtained. The NO, NO2 concentrations are lowered and the ratio is different.
- increasing isoprene with respect to magenta curve, there is no substantial change in O3.